Overview: Crucial Habits for Good Shot Generation & Suppression – a post introducing this series.
SHOT GENERATION & CONTROLLED ZONE EXITS
To be a good shot generation team, you have to take a lot of shots. Shocking information, I know. We know from years of work by many great hockey minds that overall, controlled entries into the offensive zone will lead to more shots being generated. Zone Entry Data Study* Tulsky, Detweiler, Spencer, Sznajder From that same work, we know that some teams are so good on the initial forecheck into the offensive zone that dumping the puck into the zone often leads to shot generation. In a study I did, I found that controlled zone exits (carrying or passing the puck to a teammate) lead to far more zone entry attempts than uncontrolled zone exits (dumping the puck out of your defensive zone). Clearing the Defensive Zone: The Dangers of Dumping the Puck Out
Creating rushes into the offensive zone, i.e. dynamic changes in possession as compared to offensive attacks which start with a controlled breakout or regroup) lead to confusion among the defense, less defending players in the zone and chances to get a dangerous shot on the goalie. In the player tracking project I conducted, over 57.3% of the 7142 goals tracked were scored in 7 seconds or less of zone time. Zone time for the purpose of the project started when the attacking team brought the puck across the blue line into the offensive zone and ended when the goal was scored. This was recorded by stopwatch and marked down to the hundredth of a second. 72 forwards were the subject of the study spanning from the 2012-13 season through the 2014-15 season, including the playoffs. All goals and assists tracked occurred at even strength. 46.1% of the goals tracked in the project were scored in 5 or less seconds of zone time.
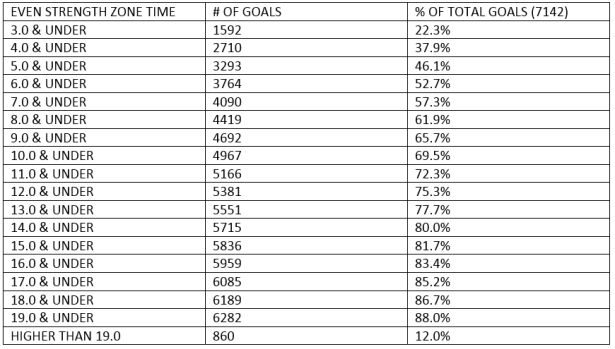
Player Tracking Project Zone Time for Goals Scored
So, all told, we know that controlling the puck and creating scoring chances are good for your team. A lack of control over what is happening with the puck obviously means you have to try to get the puck back. This is not only true for moving through zones, but in the attacking zone. Tape to tape passes among the attacking team are preferable to simply throwing the puck to an area of the ice. Even if you think your teammate has a good chance of getting the puck, the players defending their zone are also trying to get that puck. Another time the puck leaves the control of the player is when the player takes a shot. You have to take a shot in order to score a goal so every shot has a risk versus reward aspect to it.
GETTING INTO THE OFFENSIVE ZONE
Scoring is the ultimate goal in hockey. Scoring requires shooting talent and sometimes a little luck. The newly developed Expected Goals models (xG) use shots, location of the shots and more to predict future goals. This has shown to be even better at predicting future goals than shot metrics alone, but shot metrics are still better at predicting future goals than past goals are and of course, are necessary to build the foundation of the Expected Goals models. So, we know shot metrics are important to analyzing the game and predicting future scoring.
Shots take place in the offensive zone so before a team can even take a shots, they have to get there. If a team uses anything but a controlled zone exit to get out of their defensive zone, they are leaving their entry into the offensive zone up to chance and they odds are stacked against them. In the research I linked above, I found that when the team exited the zone with control (through a tape to tape pass or by carrying the puck out), they registered the next offensive zone entry attempt 88% of the time. That same work found that only 28% of pucks dumped out of the defensive zone led to an offensive zone entry attempt on behalf of the team dumping the puck out.
More recently, I looked at some of the teams that are known to be strong in shot generation to record and show the way they produce those shots. The method of entry into the offensive zone varies widely from team to team. Depending upon the Neutral Zone Forecheck they are up against, many teams default to dumping the puck into the offensive zone. You would expect that dumping the puck in would dictate that these teams don’t produce as many shots as teams who carry it in, but you would be wrong.
EXAMPLE:
5V5 OFFENSIVE ZONE ENTRIES & SHOTS
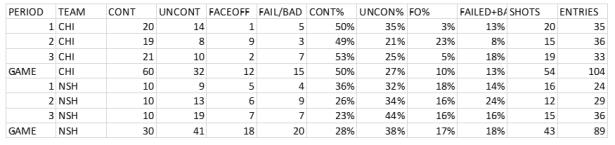
CHICAGO VS NASHVILLE 2/25/16
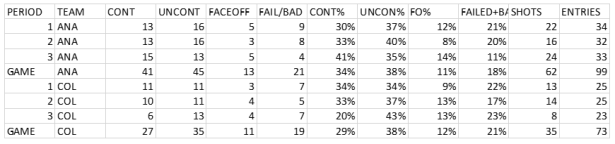
ANAHEIM VS COLORADO 3/9/16
Chicago had a controlled entry percentage of 50% plus 12 offensive zone faceoffs and generated 54 shots off of 104 total zone entries (including faceoffs). Anaheim had a controlled entry percentage of 34%, plus 13 offensive zone faceoffs and generated 62 shots off of 99 total zone entries (including faceoffs). How was Anaheim able to produce that many shots when they were dumping the puck more than they were carrying it in?
5V5 DEFENSIVE ZONE EXITS & REGROUPS
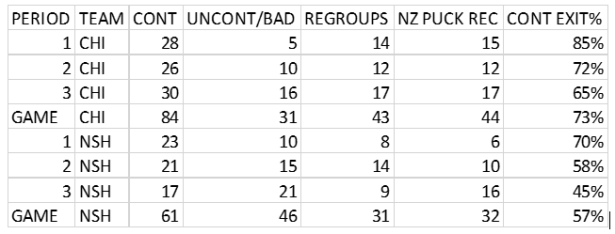
CHICAGO VS NASHVILLE 2/25/16
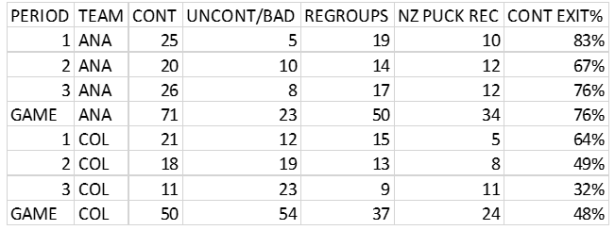
ANAHEIM VS COLORADO 3/9/16
Both Chicago and Anaheim had very high percentages of Controlled Defensive Zone Exits in the games shown above. Chicago ended the game with 73% controlled exits while Anaheim had 76%. It’s also interesting to note that both of their opponents started out strong in controlling zone exits as well, but faded quickly as the game went on. Nashville’s neutral zone loose puck recovery numbers very closely mirror Chicago’s uncontrolled zone exit numbers. Colorado’s do the same with Anaheim’s uncontrolled exit numbers. Of course, those uncontrolled zone exits (dump outs, chip outs, etc.) are sometimes recovered in the defensive zone, so that explains why the numbers don’t match up completely. Further, neutral zone turnovers do result in loose pucks up for grabs and contribute to these numbers as well.
So, while Chicago and Anaheim both produced shots and gained the offensive zone in these games, they did so in different ways. Chicago emphasized carrying the puck into the zone, while Anaheim took a dump and chase approach. Despite these differences, both teams prioritized exiting their defensive zone with control of the puck. Getting out of the defensive zone with the puck under control limits the chaos in the neutral zone and helps the team get that much closer to getting into the offensive zone.
Obviously, there are occasions when there is no real choice but to dump the puck out of the defensive zone. It happens. The point here is that when good teams are playing good hockey, they use dumping the puck out of the zone as a “Break Glass In Case Of Emergency” option. It is almost never a first resort option for teams playing quality hockey.
Some teams try “flipping” the puck out or chipping it out (a pass high in the air as opposed to a tape to tape pass on the ice surface) into the neutral zone as a means to avoid clogged passing lanes. Some use a quick shot up the boards to do the same. Both of these techniques require a concerted effort on the part of a forward high in the zone whose responsibility it is to skate hard out of the zone in order to recover the puck. Without this plan in place to recover the puck, these chips or shots up the boards are just dump outs that are likely to be recovered by the opponent. Even with this plan in place, teams that excel in controlling exits from the defensive zone resort to this technique sparingly.
5V5 ENTRIES & SHOTS
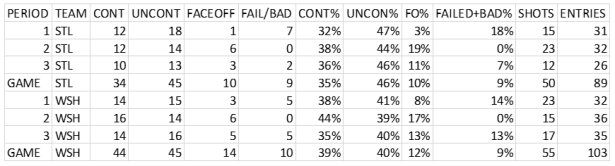
ST. LOUIS VS WASHINGTON 3/26/16
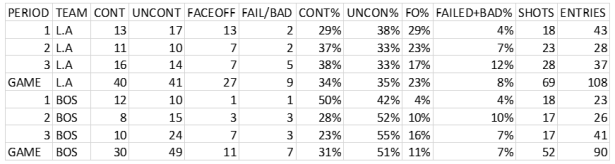
L.A VS BOSTON 2/9/16
Again, with these two games, we see all of the teams having low Controlled Zone Entry Percentages and still producing shots well.
5V5 EXITS & RECOVERY
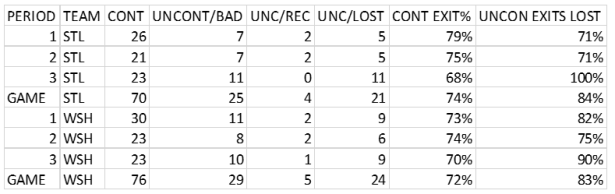
ST. LOUIS VS WASHINGTON 3/26/16
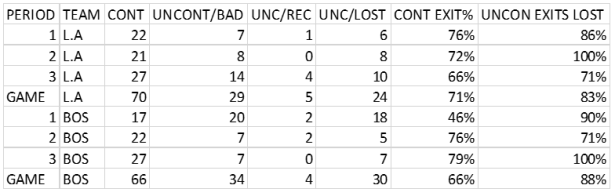
L.A VS BOSTON 2/9/16
When these teams dumped the puck out of the defensive zone, they often tried to chase down the puck in order to recover it. The columns titled “Uncon Exits Lost” means uncontrolled zone exits (dump outs, chip outs, etc) that resulted in the opponent (the team that was just on the offensive attack) recovering the puck and going back on the offensive attack. L.A managed to recover four of the fourteen dump outs in the third period of their game versus Boston mostly because the game was a blowout and Boston didn’t have much left in the tank in terms of motivation to launch a comeback while down seven goals. It was really the first period of that game that doomed Boston’s chances that day, with a meager 46% controlled zone exit percentage that resulted in L.A going right back on the attack eighteen of the twenty times Boston decided to dump the puck out of the zone.
In the Blues-Capitals game, St. Louis had a three goal lead in the third period and took their foot off the gas while Washington pushed back to try and get a goal. It is important to remember that both of those teams control their zone exits habitually so while eleven dump outs (all lost to the opponent) may not seem like a lot for other teams, it is a lot for these teams.
Here again we see teams producing shots regardless of the way they got into the offensive zone and prioritizing controlled zone exits. We also see that despite all of the skill of these teams, recovering pucks dumped out of the defensive zone, even with a plan for such an occasion, was often a fruitless effort. While it is prudent to plan for such situations to help increase your odds of recovering the puck, you certainly would not want to use a tactic with a measly 0-25% success rate all of the time.
The next post in this series will address how Offensive Zone Puck Recovery helps teams generate shots.

Were you able to figure out if there is a strong correlation between controlled zone exits and shot generation at a more aggregate level? I would assume there is but this piece just shows a few examples where it was true. I did see this:
“In the research I linked above, I found that when the team exited the zone with control (through a tape to tape pass or by carrying the puck out), they registered the next offensive zone entry attempt 88% of the time. That same work found that only 28% of pucks dumped out of the defensive zone led to an offensive zone entry attempt on behalf of the team dumping the puck out.”
I guess what I’m wondering is what the overall correlation is between shot generation and clean zone exits for all teams/games. Perhaps I just missed it.